Abstract
Experiential graphic design operates in shared, public environments where meaning is shaped not only by content but by co-presence: visitors encounter information while observing, and being observed by, other people. In social-impact contexts, this shared condition creates a design challenge that individual media never faces. Even when visitors are strongly aligned in their beliefs, uncertainty about what others think can suppress action. This paper introduces social legibility — the degree to which an environment makes collective belief and readiness to act perceptible to its participants — as a distinct design consideration for experiential design. Drawing on the social psychology of pluralistic ignorance and norm misperception, we argue that in the context of social impact projects, hesitation to act in shared space is often a failure of social legibility rather than a failure of motivation or understanding. We ground this framework in a year-long design research study conducted with the Yale Peabody Museum and the Yale Program on Climate Change Communication, in which an interactive climate exhibit held content constant while varying only when aggregated visitor sentiment became visible. Visitors shown evidence of shared concern before an invitation to act were more than 2.5 times as likely to take that action — without any change in reported attitudes. We close with practical design strategies and implications for practice, evaluation, and pedagogy.
The study
The design research ran a controlled A/B comparison inside a single live exhibit at the Yale Peabody Museum: the same climate content, the same interaction, with only one variable changed — whether visitors saw evidence of other visitors’ shared concern before or after being asked to act.
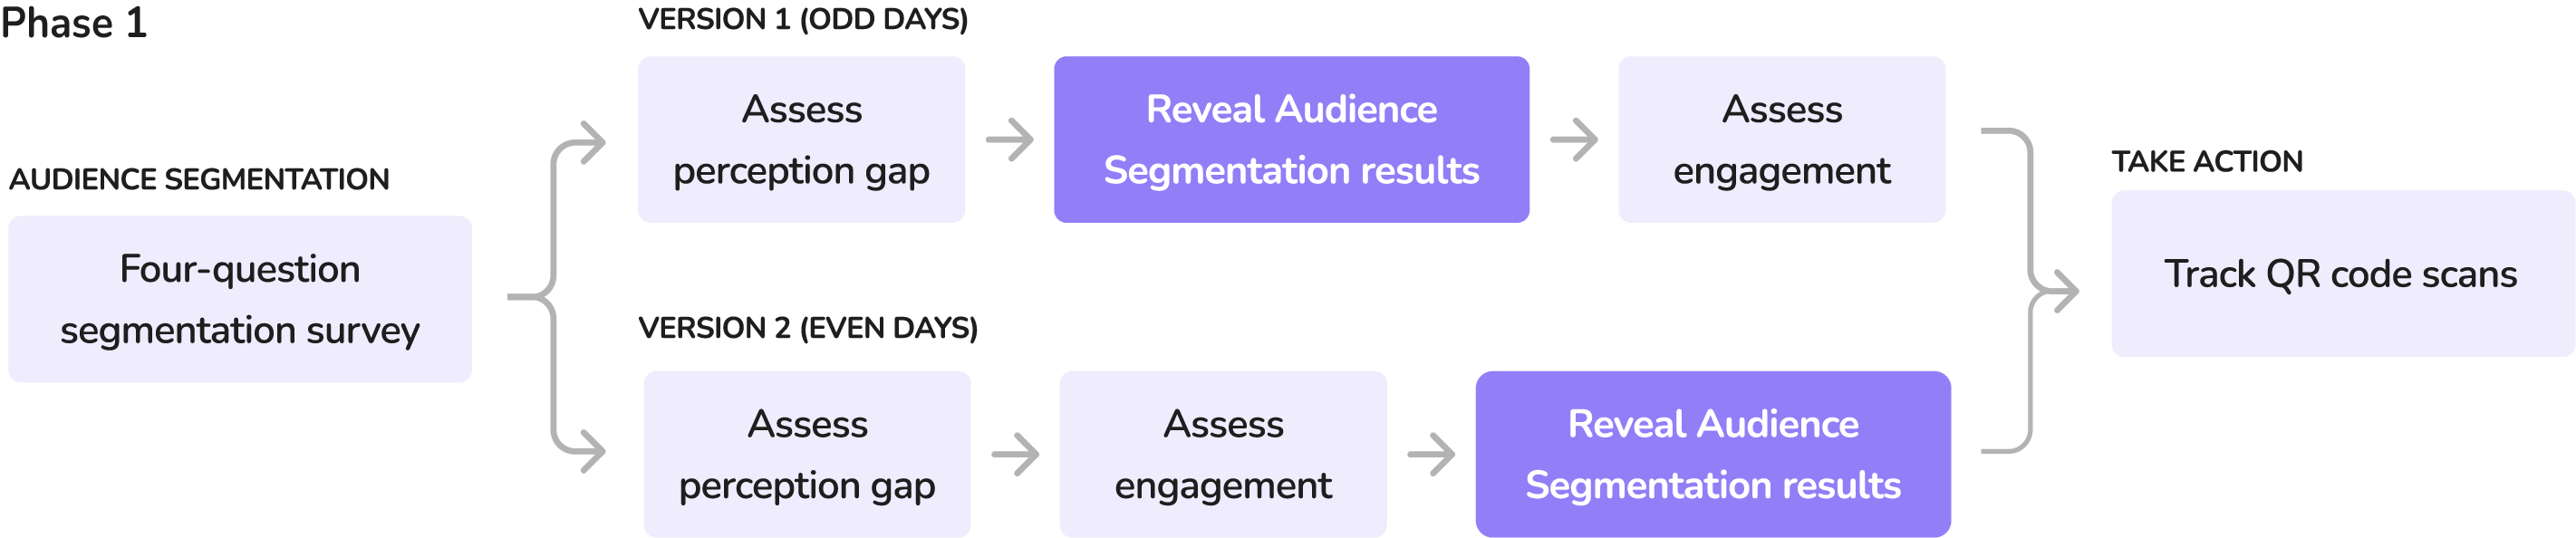
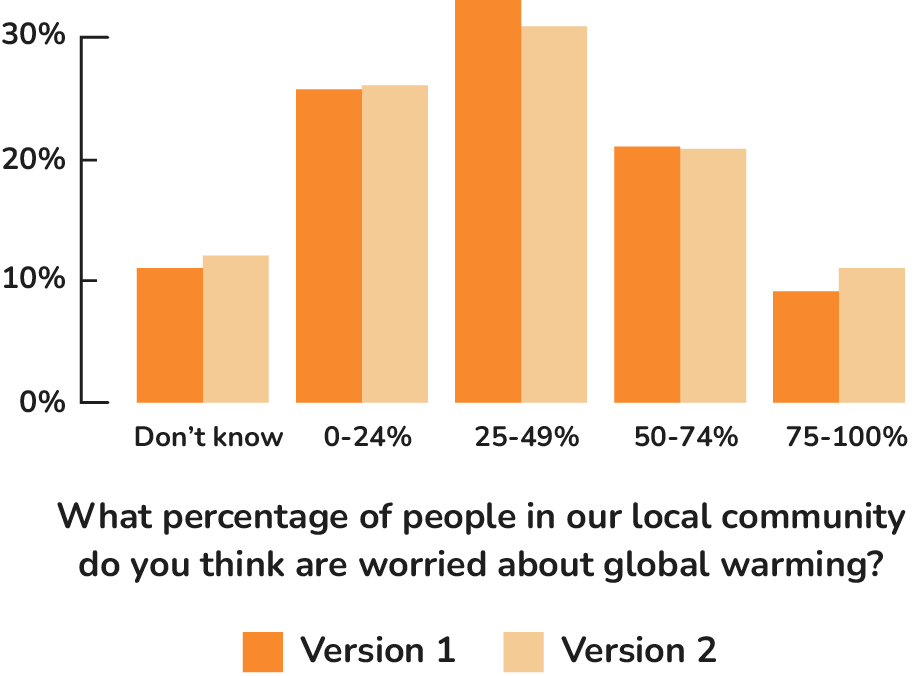
This builds directly on the audience-segmentation research in Using Social Science to Improve Social Impact, this paper’s 2023 predecessor, and underlies the audience-research behind our environmental communication practice. The full study — 962 visitor sessions, the Phase 2 design now running, and the statistics behind the 2.5× figure — is documented in our technical report, Investigating the Climate Perception Gap Through Interactive Design. Read the preprint